

When you need to know how fast data actually moves through PCIe® links, fabrics, or DMA engines, CPU IPC/CPI isn’t the right lens—those are core metrics. Real I/O bandwidth (BW) and latency live in the uncore (I/O controllers, fabrics, memory subsystem). Silicon vendors instrument these blocks with Performance counters that software can read in real time. For example, Intel’s IIO (Integrated I/O) uncore PMU is documented for analyzing PCIe controller traffic from software, while NVIDIA Jetson platforms expose HSIO/UCF uncore PMUs (readable via Linux perf) to measure bus/I/O events directly in software.
1) Throughput from Uncore PMON/PMU Counters
What the hardware exposes (registers you read)
Most I/O PMON blocks provide:
- Cycle accounting (all in the PMON clock domain):
- active_cnt represents cycles where data moves forward without obstruction.
- busy_cnt represents cycles where data is ready but blocked by downstream flow control.
- idle_cnt represents cycles where the interface is completely inactive
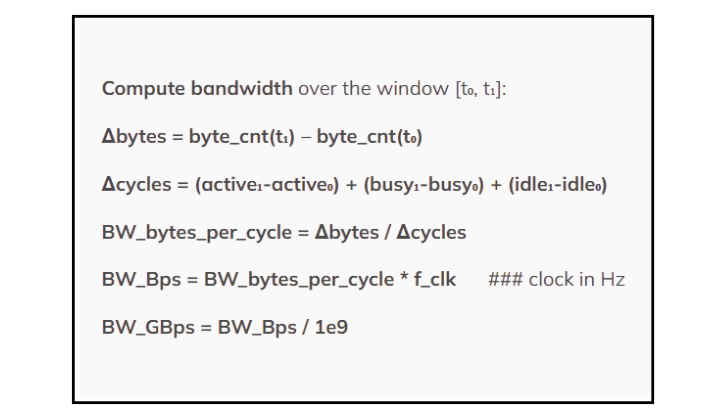
The window time base in cycles is:
Δ cycles = Δ active_cnt + Δ busy_cnt + Δ idle_cnt
Data movement:
- byte_cnt: payload bytes observed by the path (preferred; handles variable sizes & protocol effects)
- pkt_cnt: number of packets/transactions (use only when packet size is fixed)
How software samples BW counters at t₀ and t₁
These counter values live in memory‑mapped registers (CSRs) exposed by the uncore PMU driver:
1. Reading CSRs
Each counter is a register (often 32‑ or 48/64‑bit). Software reads them via:
- A kernel interface (e.g., Linux perf PMU events or ioctls) that abstracts address/encoding, or
- Direct MMIO/CSR reads in firmware/RTOS environments.
(Jetson docs show perf stat with uncore events; libpfm exposes Intel IIO events similarly.) [wseas.us], [techcommun…rosoft.com]
2. Snapshot semantics (common patterns)
- Free‑running counters: read each register back‑to‑back at t₀, then again at t₁; deltas are your window values.
- Freeze/snapshot: some PMUs provide a freeze bit to latch all counters atomically; software sets freeze, reads, then clears it—repeat at t₁.
- Read‑to‑clear windowing: reading (or a control bit) clears counters, so the next read yields the next window directly. Vendors document which mode applies for a given PMU. [wseas.us]
3. 64‑bit reads
If counters are split into HI/LO, the driver or your access routine handles atomicity (e.g., read LO, then HI, re‑check LO). Platform PMU drivers usually abstract this.
Example :
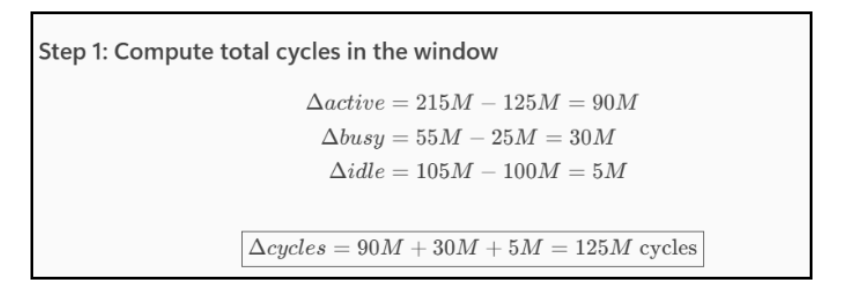
| Counter | Value at t₀ | Value at t₁ |
| active_cnt | 125,000,000 | 215,000,000 |
| busy_cnt | 25,000,000 | 55,000,000 |
| idle_cnt | 100,000,000 | 105,000,000 |
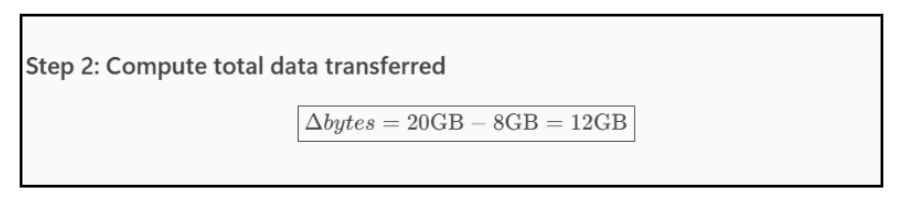
| byte_cnt | 8,000,000,000 | 20,000,000,000 |
2) Histogram‑Based Latency
Latency is the amount of time it takes for a request to travel through a system from initiation to completion.
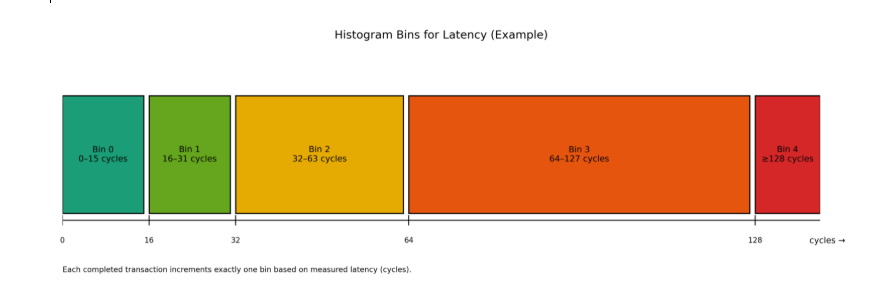
In Histogram based implementation , each completed transaction increments exactly one latency bin (based on measured cycles). Ranges are configurable (linear or exponential), and the counters are monotonically increasing.
How a bin counter increments (what the hardware does)
- Ingress timestamp: At request enqueue, the PMON domain starts the latency cycle counter.
- Egress timestamp: At request completion, the PMON domain stops the cycle counter and derives the latency from cycle counter.
- Histogram update: The computed latency is evaluated against configured threshold boundaries, and the appropriate histogram counter (hist_bin_k) is incremented.
if L ∈ [L0, U0]: hist_bin_0++
elif L ∈ [L1, U1]: hist_bin_1++
…
else: hist_bin_N++ # open-ended last bin (≥ L_N)
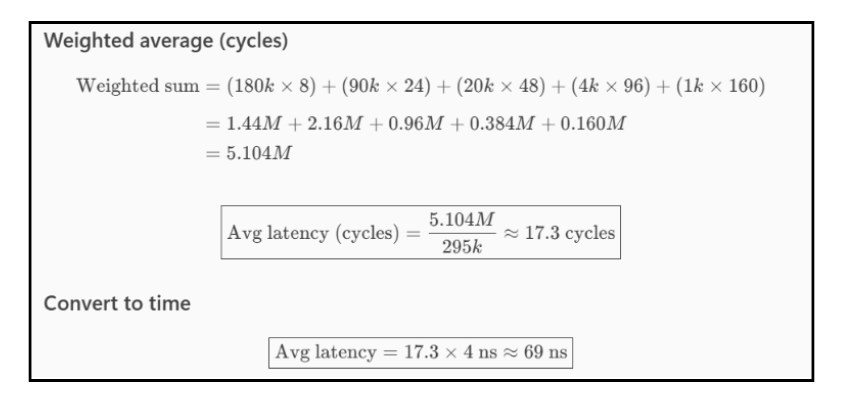
What software computes from the bins
Sample all bins at t₀ and t₁, then
Δbin_k = bin_k(t₁) − bin_k(t₀).
Average latency (use a representative midpoint mid_k per bin):
total_pkts = Σ_k Δbin_k
avg_latency ≈ (Σ_k Δbin_k * mid_k) / total_pkts
Example :
| Bin | Latency Range | Representative midₖ |
| Bin 0 | 0–15 | 8((0+15)/2) |
| Bin 1 | 16–31 | 24((16+31)/2) |
| Bin 2 | 32–63 | 48((32+63)/2) |
| Bin 3 | 64–127 | 96((64+127)/2) |
| Bin 4 | ≥128 | 160( implementation specific fixed value) |
PMON histogram counters
| Bin | Count at t₀ | Count at t₁ |
| hist_bin_0 | 1,000,000 | 1,180,000 |
| hist_bin_1 | 600,000 | 690,000 |
| hist_bin_2 | 200,000 | 220,000 |
| hist_bin_3 | 20,000 | 24,000 |
| hist_bin_4 | 5,000 | 6,000 |
Step 1: Compute per‑bin deltas
| Bin | Δ Count |
| 0 | 180,000 |
| 1 | 90,000 |
| 2 | 20,000 |
| 3 | 4,000 |
| 4 | 1,000 |
Total packets=295,000
3) A Minimal, Real‑Time Monitor Loop (software pattern)
- Pin the sampling thread to avoid migration noise.
- Read (active/busy/idle, byte_cnt, all hist_bin_k) at t₀ (use freeze/snapshot if available).
- Sleep Δt (e.g., 100 ms).
- Read again at t₁.
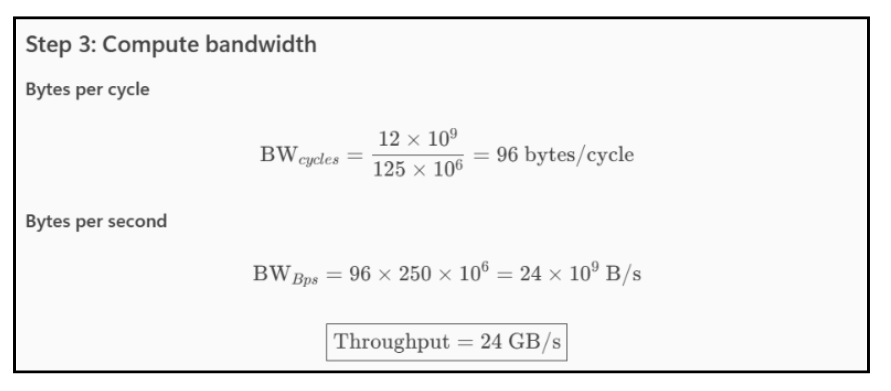
- Compute:
- a.Throughput: Δbytes/Δcycles * f_clk
- b. Latency: mean (midpoints)
References
- Intel IIO uncore PMU (PCIe I/O analysis) — the IIO PMU is explicitly described as the facility to analyze PCIe controller traffic from software (available via libpfm / Linux PMU). [techcommun…rosoft.com]
- NVIDIA Jetson uncore PMUs (HSIO/UCF) — documentation and perf examples for reading bus/I/O events (including counters and frequencies) to compute bandwidth/latency in software. [wseas.us]